Protein-protein vs. protein-small molecule interactions
This exercise will help you compare protein-protein interfaces with protein-small molecules interfaces, paying particular attention to noncovalent interactions and buried surface area.
First download the structure of PFKFB3 (in complex with ADP and PEP), PDB code 2DWO, from the PDB.
Open the .pdb file in PyMol (if you do not have PyMol installed see here: https://www.wiki.ed.ac.uk/pages/viewpage.action?spaceKey=sbsdocs&title=Pymol+Installation). Note the functional dimer - there are two protein chains, each with ligands bound.
Type "sele resname ADP and chain A" to select the ADP molecule in the A monomer. In the objects list on the right hand side you will see a new object appear, named "sele" (short for selection)
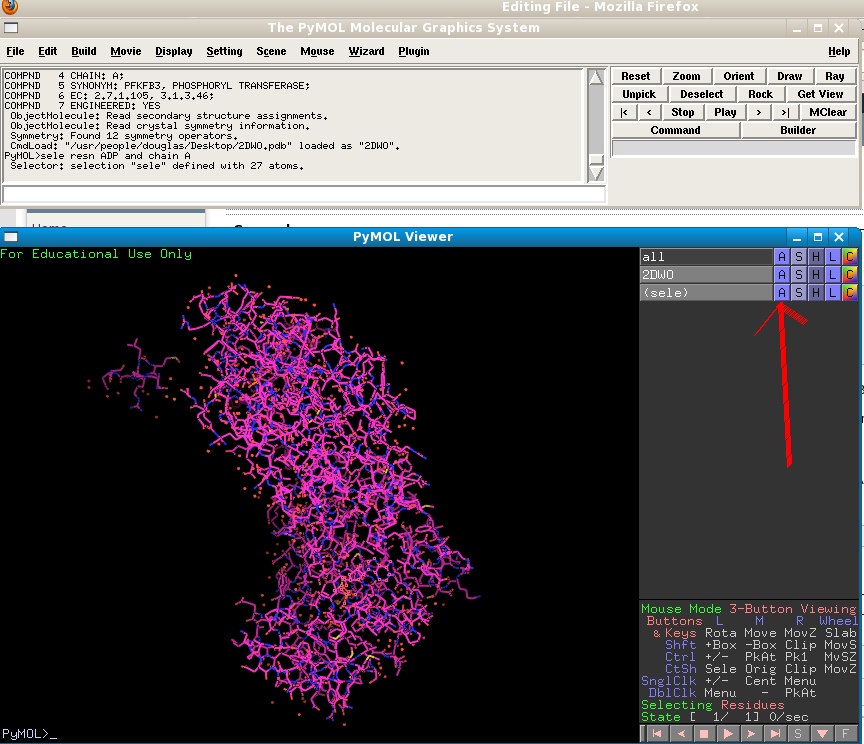
Click on the A ("for Action") menu next to the "sele" object in the objects list. Choose "orient". You will see your view automatically shift to centre on the ADP ligand. Its atoms are highlighted with a pink square to show that it is currently selected. Click on the grey "sele" box in the objects list to hide these square - but note that the ADP molecule will still be selected.
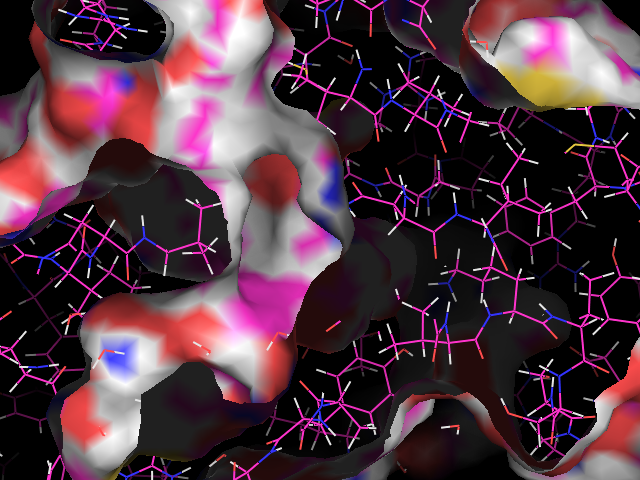
Now examine the noncovalent interactions between the ADP molecule and the PFKFB3 protein. Use the 'distance' (with mode=2) command to highlight the polar interactions:
https://pymolwiki.org/index.php/Distance
You should see something like this:
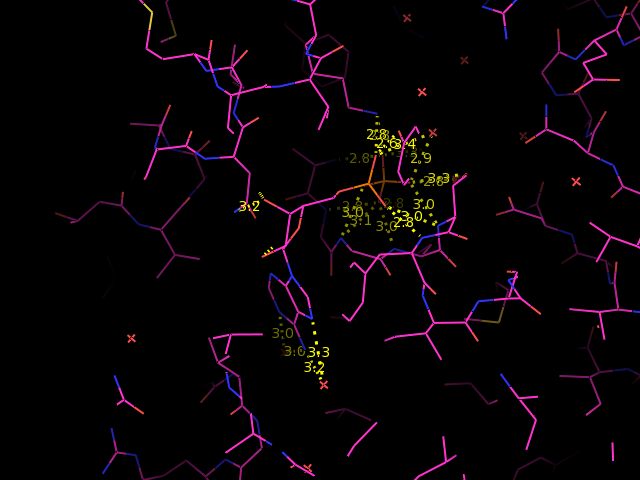
You can see that there are a large number of polar interactions. But are all of them hydrogen bonds? It may help you to add hydrogen atoms to the structure to answer this question. You will also need to utilise your knowledge of which chemical groups can act as hydrogen bond donors or acceptors, and your knowledge of the length of a typical hydrogen bond.
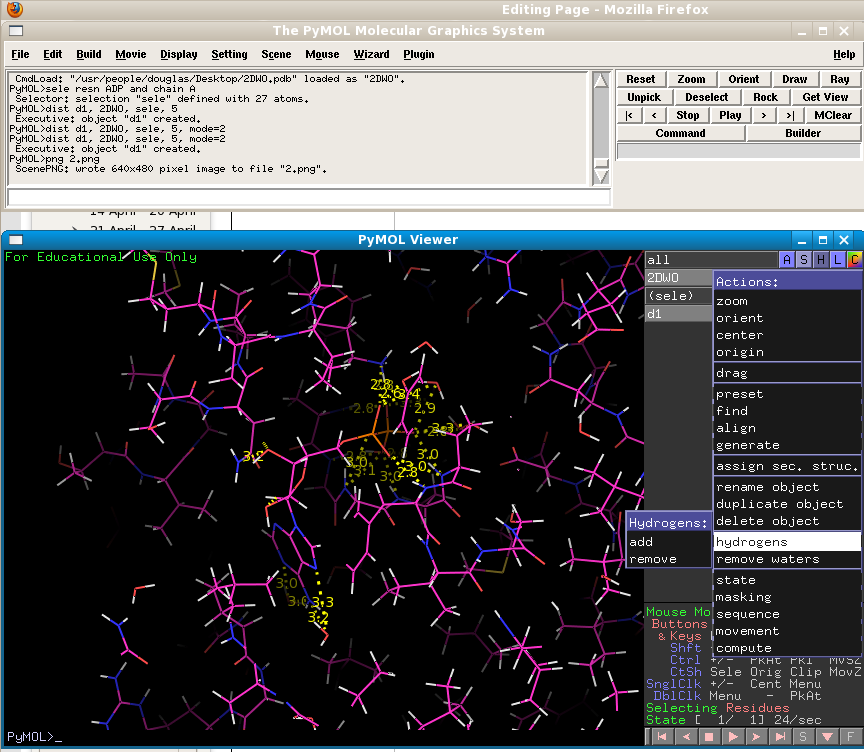
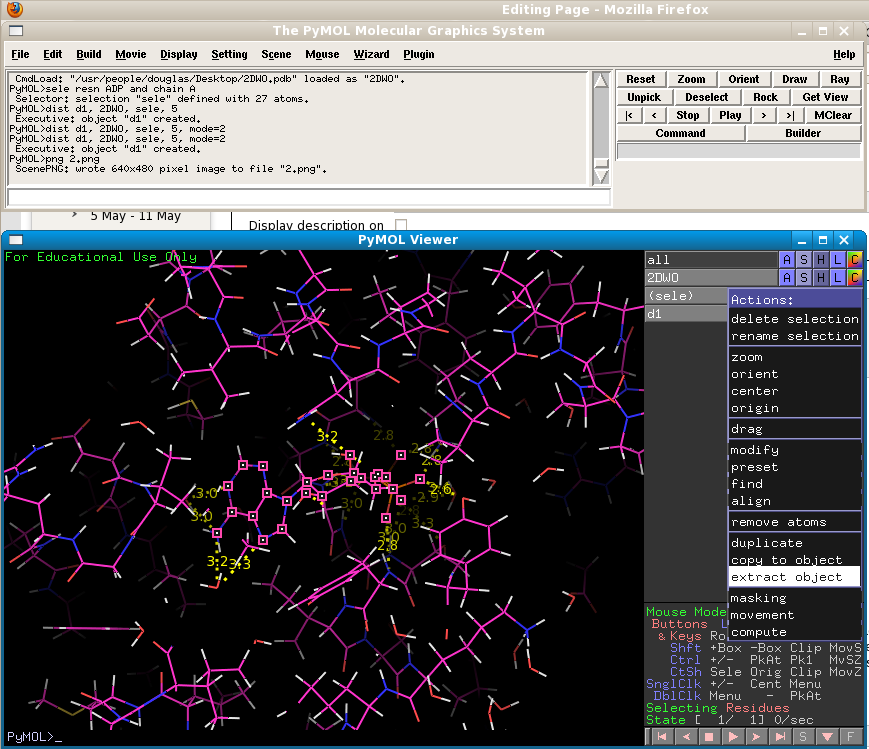
Now we will examine the structures using a different representation. The "surface" representation in PyMol gives the user a more realistic view of how atoms "see" each other by drawing them according to their van der Waals radii. This will allow us to get a better idea of the shape of the protein's ligand binding pocket. But first we must remove the ligand from the pocket by using the "extract object" function on the selected object. Remember that you selected the ADP molecule BEFORE you added hydrogens - this means that the H atoms added to the ligand are not part of your "sele" object! So we first need to redefine our selection so that the hydrogens are included: "sele resname ADP and chain A". Now we can extract the ADP ligand into a new object:
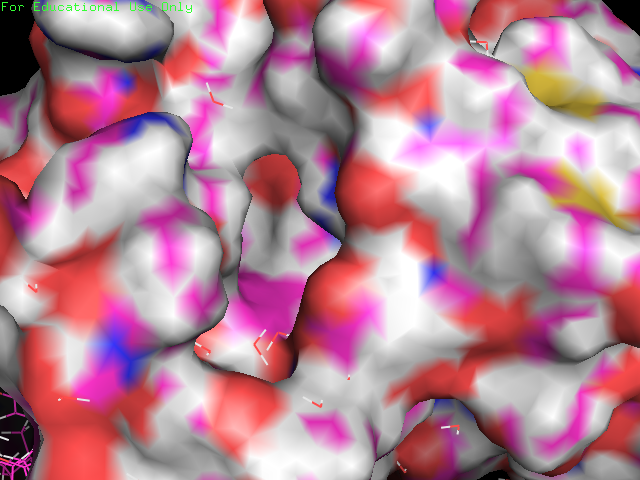
Switch the ligand off by clicking the grey "ob01" object in the objects list. Now you will see only the protein. Use the Show: surface command to draw the protein in surface representation. Move the mouse wheel to alter the "clipping planes" so that the surface is complete. Your view will go from this:
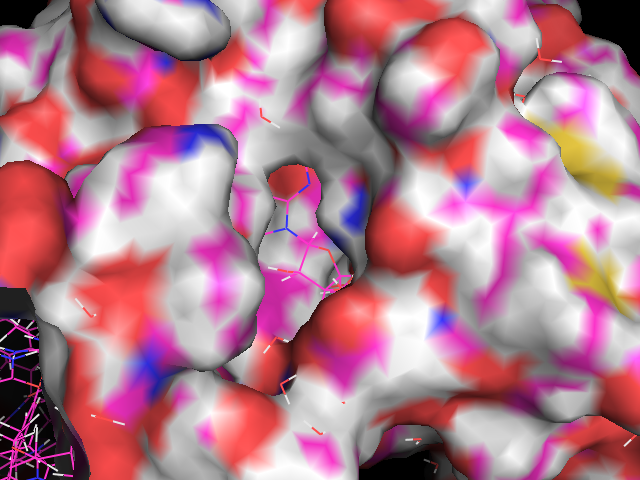
To this:
You can now get a good idea of the size and shape of PFKFB3's ATP binding pocket. Note the water molecules still visible in "lines" representation. If we now make the ADP ligand visible again (by clicking on the grey "obj01" in the objects list) , we can see how well it fits the pocket, and how deeply buried it is. Note how little of it is exposed to the solvent (water).
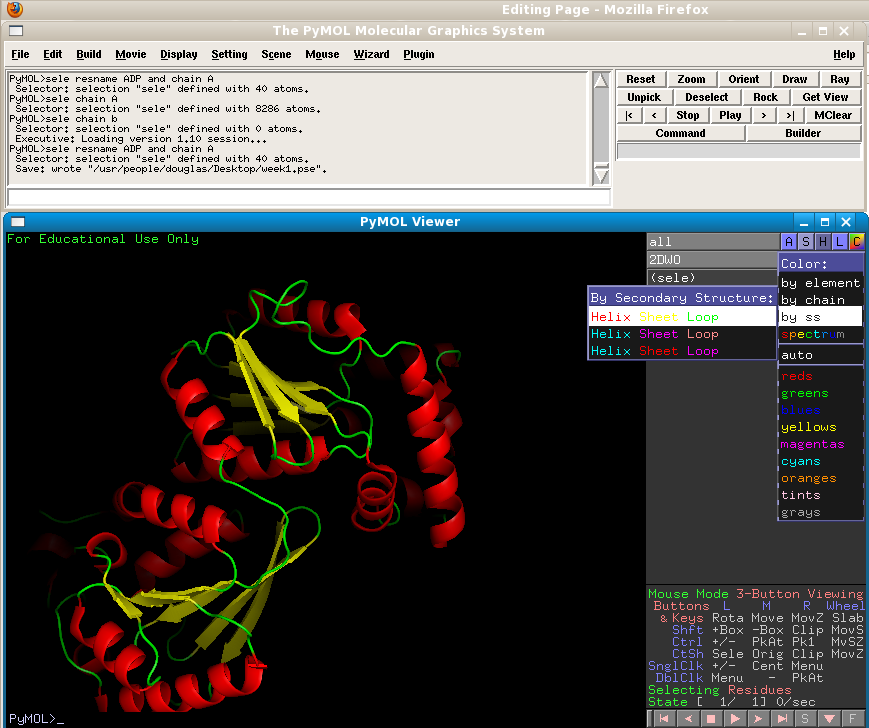
We will now examine the major protein-protein interaction present in this structure. Start by hiding the surface representation, and instead displaying the protein as "cartoon" - this will show the secondary structure (coils, helices, beta sheets). Colour according to "ss" to highlight these.
Now, the PDB file we downloaded only contains one PFKFB3 protein molecule. But in the cell, it is known that PFKFB3 functions as a homodimer. Why isn't there two protein molecules present in the structure file? The reason for this is that the homodimer is symmetrical enough for both to be unnecessary for solving the structure. The software used to solve and refine the structure simply uses one molecule, in conjunction with a collection of symmetry operators that depend upon the spacegroup of the crystal, to reproduce the second molecule, making two molecules redundant. However, we can do the same thing in PyMol in order to reproduce these symmetry mates.
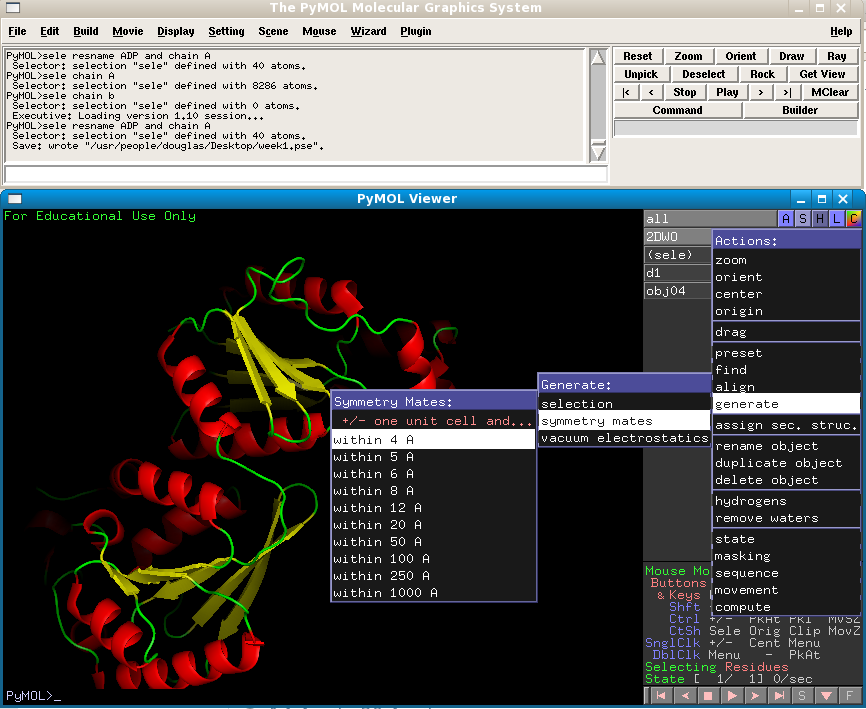
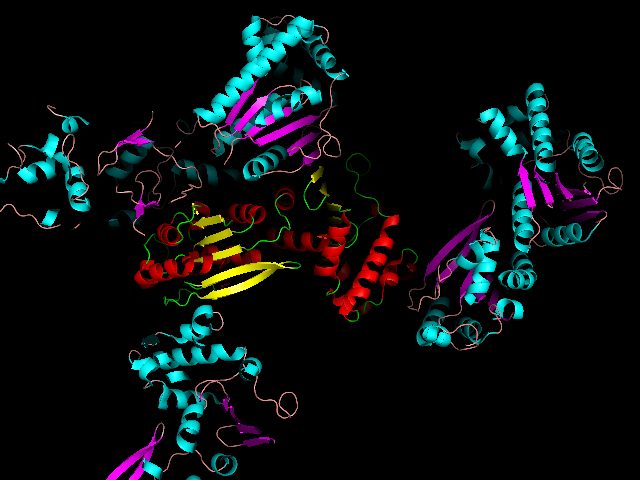
You will see a number of duplicate protein molecules appear, arranged in the same way as the were in the crystal. Presumably, one of these is our protein's partner in the dimer. Can you figure out which one? You should be seeing something like the following (although I have coloured the symmetry mates according to a different "ss" colour scheme to make things clearer):
One clue is in the area highlighted here:
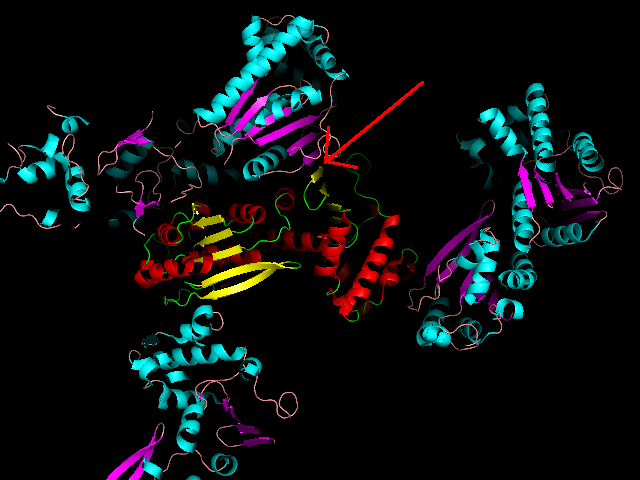
A zoomed-in view is clearer:
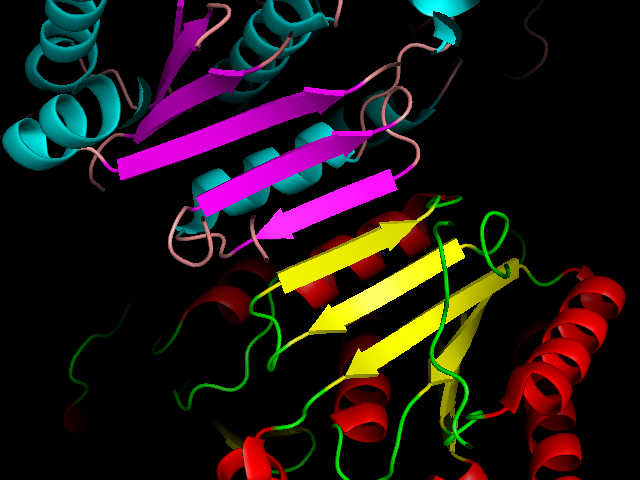
You can see that a complete beta-sheet is formed from two sheets from two different protein molecules.
If you show the central protein molecule as surface you can also see how much these two monomers are interacting.
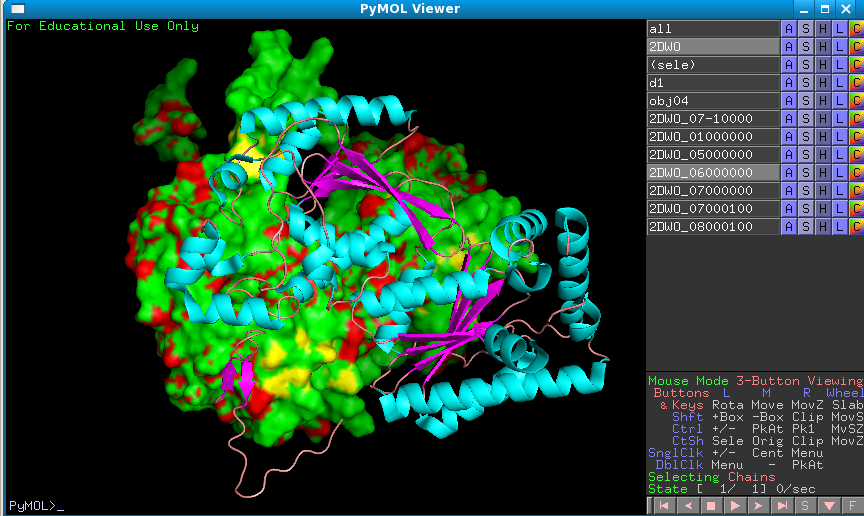
It would appear then that this is the functional dimer.
The last thing to think about is what the structure of this protein means for its druggability. It is clear that if the interaction between it and its small molecule nucleotide substrate (ATP) was disrupted, the enzyme would cease to function. Similarly, if the functional unit of the enzyme is a dimer, then disrupting this interface would also interfere with its activity. But would a method that achieved one of these goals work for the other? Consider the large differences in the characteristics of the two types of interface when thinking about this question.