Comparing enzyme active site pockets
This exercise will expand on the previous exercise by taking a closer look at the substrate binding pockets of PFKFB3. We will examine exactly how the positions of the substrates relate to the enzyme's activity, and we will investigate techniques for comparing binding sites in detail. Such examinations form part of any druggability analysis.
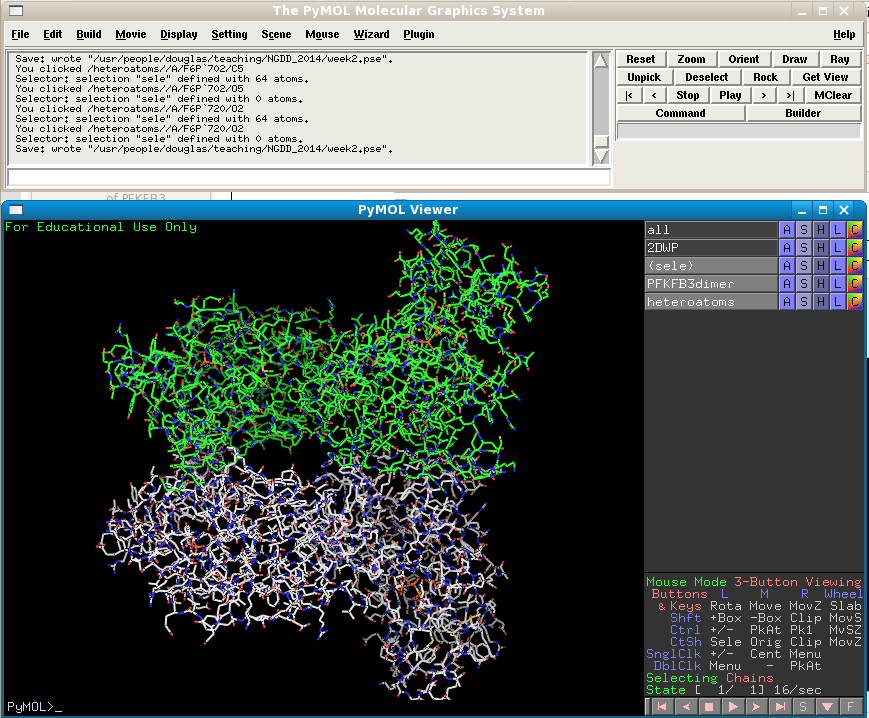
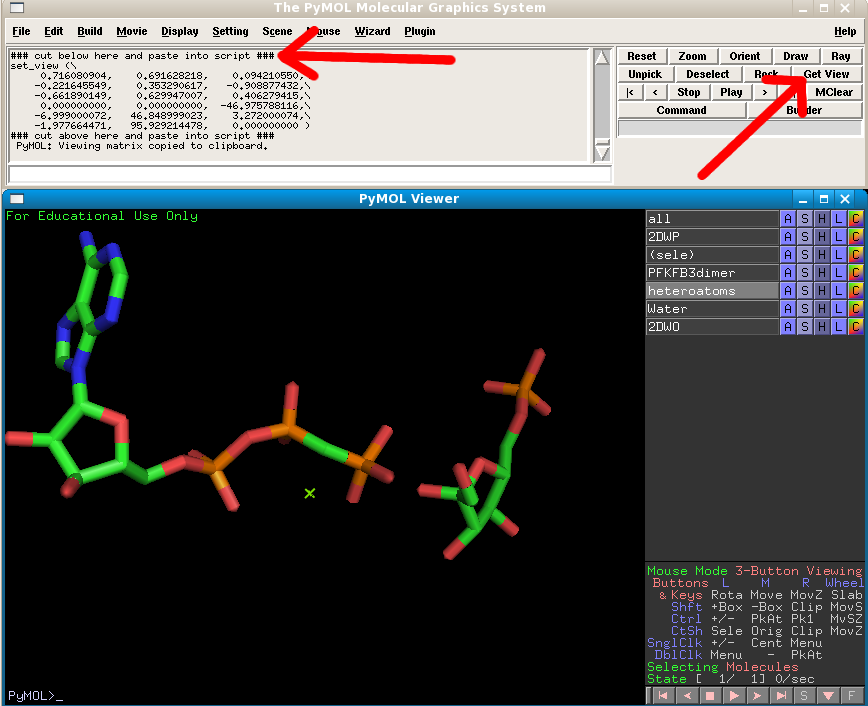
First go to the RCSB and download PDB 2DWP (the PFKFB3 structure bound to AMP-PNP and Fructose-6-phopshate (F6P)) in PyMol. Then generate the symmetry mates of the monomor that's present in the asymmetric unit (see previous exercise). Delete all symmetry mates except for the central monomer's dimer partner, and color it differently. Then select the original monomer and its partner and extract to a new object named PFKFB3dimer. Extract all heteroatoms (non-macromolecular atoms) into a new object, which should be renamed to "heteroatoms". Your view should now look like this:
Now we need to remove the water molecules from the heteroatoms object. Type "select resname HOH", extract the selection to a new object name Water, and hide that object by clicking on its gray bar in the object list.
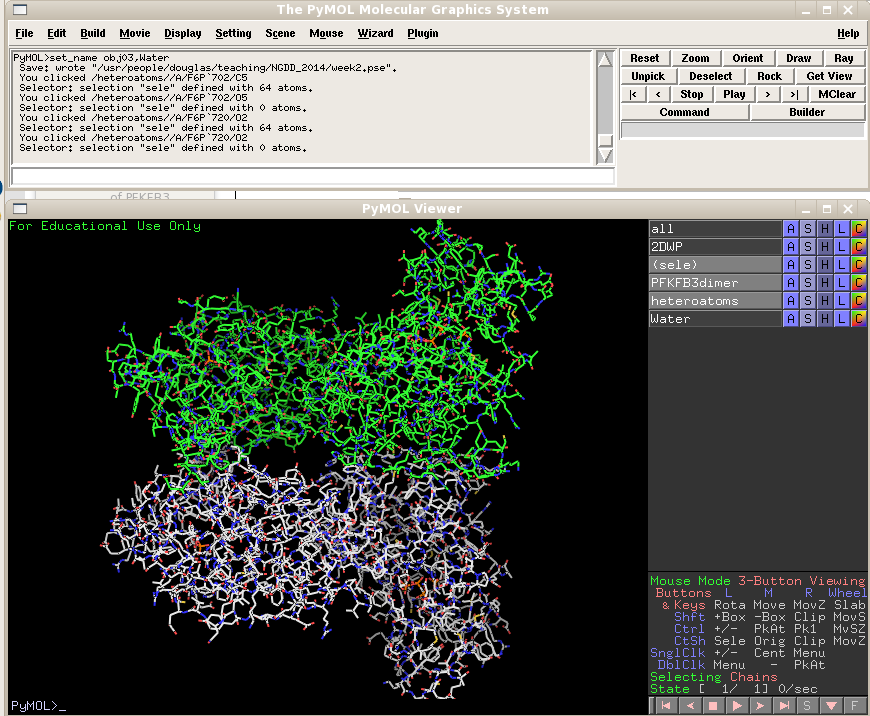
If you click on the heteroatoms object (which now only contains the AMPPCP and F6P ligands) on and off you will spot where the ligands located.
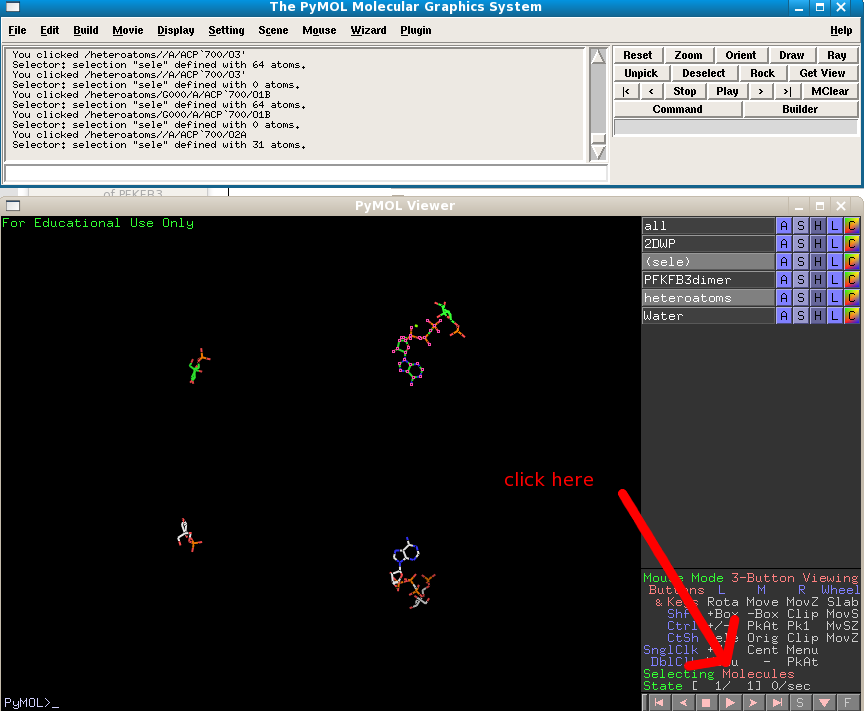
Switch the PFKFB3dimer object off, and change your click selection criteria to "molecules", and click on one of the AMPPNP molecules:
Next to the "sele" object choose Orient and you view will automatically zoom in on the molecule. Change the heteratoms object to show as sticks.
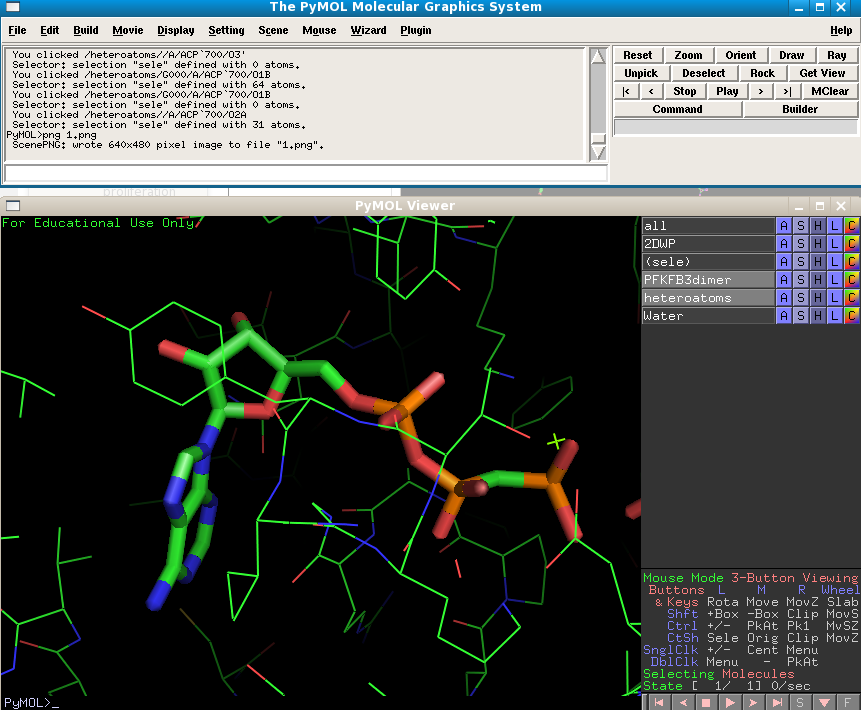
Shift your view to the right slightly till you have both the AMPPCP (resname ACP) and the substrate F6P in view. Recall what it is the PFKFB3 does exactly, i.e. what is its enzymatic activity. Can you see how the positions of these small molecules relate to the activity? On which atom is the F6P further phosphorylated? Think about what sort of molecule would be required to disrupt this activity, and how it would work.
Click on the "Get view" button and copy the view transformation values that appear in the top window into your clipboard. Now load the 2DWO structure into your current PyMol session. This will cause your view to automatically change, but you can return to the previous view by pasting in the transformation you copied.
Make the new 2DWO structure visible and show its ligands as sticks:
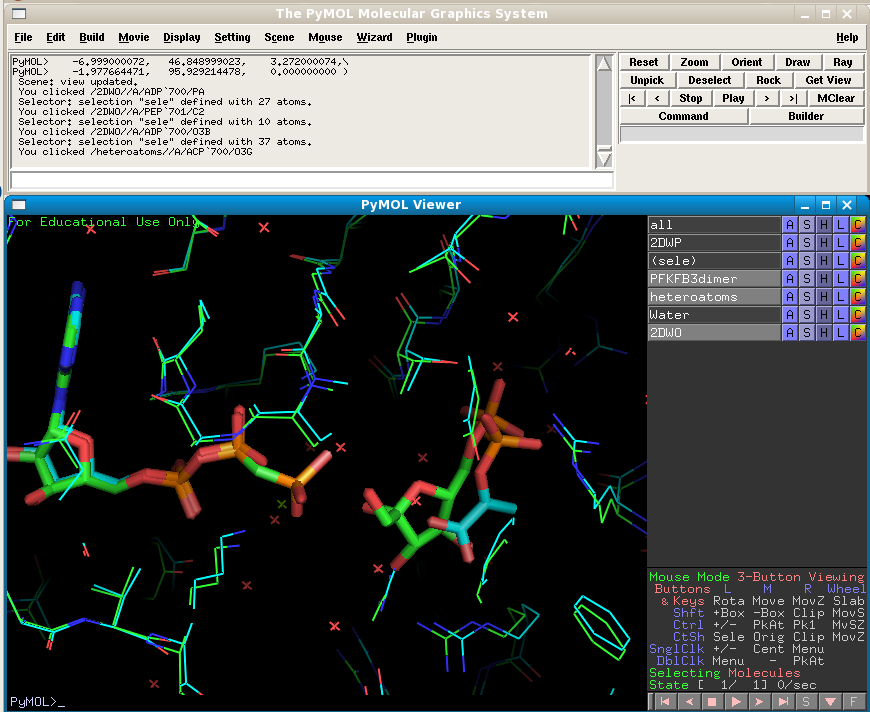
It has different ligands in its active site compared to 2DWP. Check their respective RCSB pages to find out what they are. Note that both structures have been crystallised in the same spacegroup so they automatically line up well in PyMol. But if we want to improve the alignments of the ligands we need to align the structures according to the residues in the active sites.
I will leave this up to you to discover how to do. But the first step is to make a list of all the residue numbers that make up the binding site. A precise way of defining whether a residue is part of a protein's binding site is simply how close that residue is to any ligand. So, for example, you could say that any residue that has an atom within 5 Angsrtoms of any of the ligands counts as part of the binding site. The "distance" command, which you have seen already, can help you with compiling the list.
Once you are happy that you have decided on your binding site definition, you must align the structures according to these residues only. You will need to use the PyMol "fit" command.
http://www.pymolwiki.org/index.php/Fit
Once you have successfully executed the command, the Root Mean Square Deviation of the alignment will be reported in the upper window. This is a measure of how closely the two sets of atoms could be superposed. A low number means a close fit, a high number means there are large differences in the conformations of the active sites compared. Thus these differences can be attributed to the different ligands bound in each.